Bacteria on Classroom Surfaces Vary With Human Contact
Summary
Figure 2
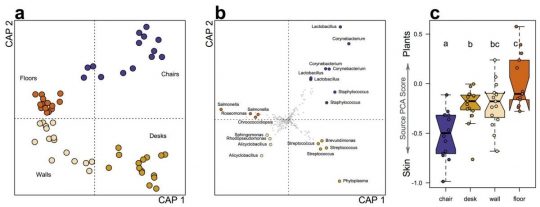
Figure 2 Surfaces harbored significantly different bacterial communities and were linked to differential human contact. (a) Bacterial communities were constrained by four different surface types using distance-based redundancy analysis (DB-RDA; constrained inertia = 11.4%) and were significantly different among types based on Canberra taxonomic distances (P = 0.001 from permutational multivariate analysis of variation). (b) Bacterial operational taxonomic units (OTUs) from DB-RDA are shown weighting communities in the same four primary directions. The first and second axes from DB-RDA are used in both ordinations (CAP 1 and CAP 2) . The strongest ten weighting OTUs for each surface type are highlighted if they were also significant indicator OTUs (all P values <0.05). (c) All samples were compared to potential source environments using principal components analysis (PCA), and the first principal component (37.8% of variance explained) was used as a surrogate for community similarity to either phyllosphere or human skin bacterial communities. Boxplots delineate (from bottom) minimum value, Q1, median (Q2), Q3, maximum value; notches approximate 95% confidence around median value, and outliers fall outside of the quartile range. Letters above each box indicate significant groupings after Tukey’s hones significant difference (HSD) test (adjusted P value <0.05).
Videos
Press
Who’s Been Sitting In My Chair? The Microbes That Live Indoors
Ben Johnson, BioMed Central Biology Blog, 7 Mar 2014
Publications
“Bacterial Communities On Classroom Surfaces Vary With Human Contact” // Bio Med, Central, James F Meadow, Adam E Altrichter, Steven W Kembel, Maxwell Moriyama, Timothy K O’Connor, Ann M Womack, G Z Brown, Jessica L Green, Brendan J M Bohannan
Biology and the built environment center
(541) 346-5647 103 Pacific Hall 5219 University of Oregon Eugene, OR 97403-5231